GreenScan
An application created during the U.S. Census Bureau Open Data for Good Challenge.
Check it out on your mobile* device
Role: Research Lead & UX Designer
Product Type: A mobile web application with foresight to launch in App Store.
Team: 7 Members (UX Designers, Data Scientist, Software Engineer)
Duration: 7 Weeks
Tools: Figma, FigJam, Notion, Slack, Google Suite, Zoom
Context
Problem:
Open data is all around us – in the apps and websites we use, the tools that help families find housing and schools, and more. Federal open datasets need to be enabled through digital tools that put data at the fingertips of communities, businesses, families, and decision makers nationwide.
Challenge:
Our category was Climate, Resilience, and the Natural Environment.
Focusing on reducing ocean plastic pollution, creating markets for recycled materials, & community resilience to climate change, or other similar natural environment and climate challenges.
Goal:
Create a product that can increase awareness of single use plastics and its impact on local and larger communities.
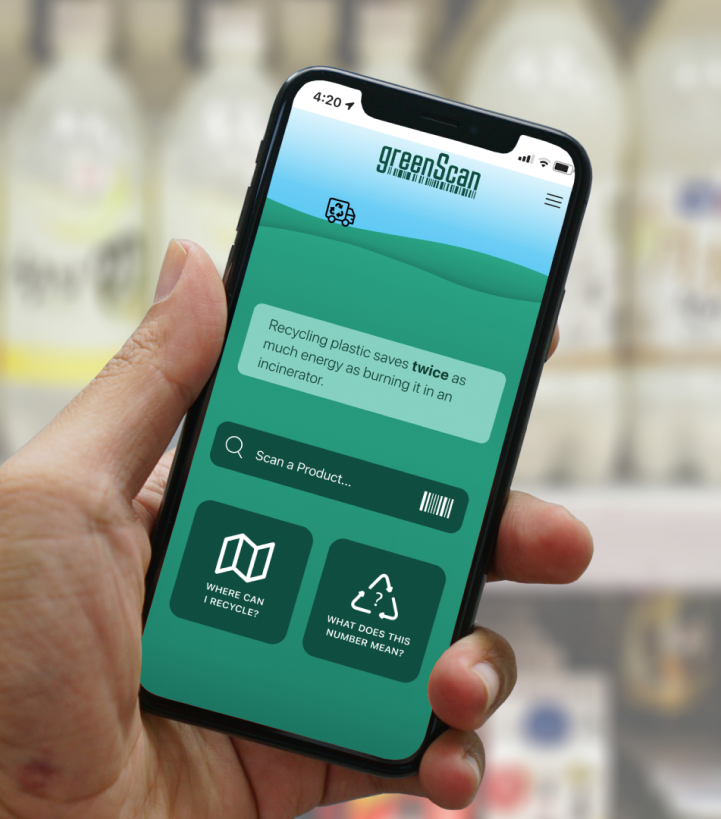
What is GreenScan?

GreenScan is a high impact application focused on reducing single-use plastics using open source federal government data.
Our mission is to raise awareness of single use plastics and its impact on local and larger communities and encourage users to take action in creating sustainable recycling habits.
At GreenScan, users have access to immediately scan a product, look up information on recycling codes and numbers and also find near by recycling locations for drop off.
Design Process

Empathize
I was the sole researcher for this part of the design process.
Step 1: Create a Research Plan
My hypothesis makes a great starting point for research, “If users have more information on how to recycle single use plastics, then they will be able to recycle more sustainably.” This sets the stage for validating the need and creating an underlying objective. It was important for me to understand from the community, what their current recycling habits are and what the knowledge underneath those habits is. Creating key questions to gather this data was essential.
Going into the interview process, it was also important to speak with people all over the untied states, within different cities and within different communities. Some challenges I faced:
Limited to personal network
Limited interest in in-person interviews
To combat these challenges, I created user interview questions as well as a questionnaire survey to send out on socials, slack, discord, any medium to generate responses. Generally, I know the criteria for choosing a survey is typically when the goal is to hear from a lot of users relatively quickly and get more basic information as opposed to interviews where you can ask the ‘why’ behind and pull more data. It seemed when I reached out within my network, people expressed interest and wanted to help, but didn’t feel comfortable being interviewed. They’d ask for a link to fill out on their own time, and to also send within their network. Thus the questionnaire was born for this target audience.
User Interviews
Topics:
Recycling Habits
Recycling Knowledge
Current Technology Used
Quantitative Research:
17 Respondents (interviews & questionnaire)
45% Urban Communities
65% Suburban Communities
Various Professions and Educational Levels
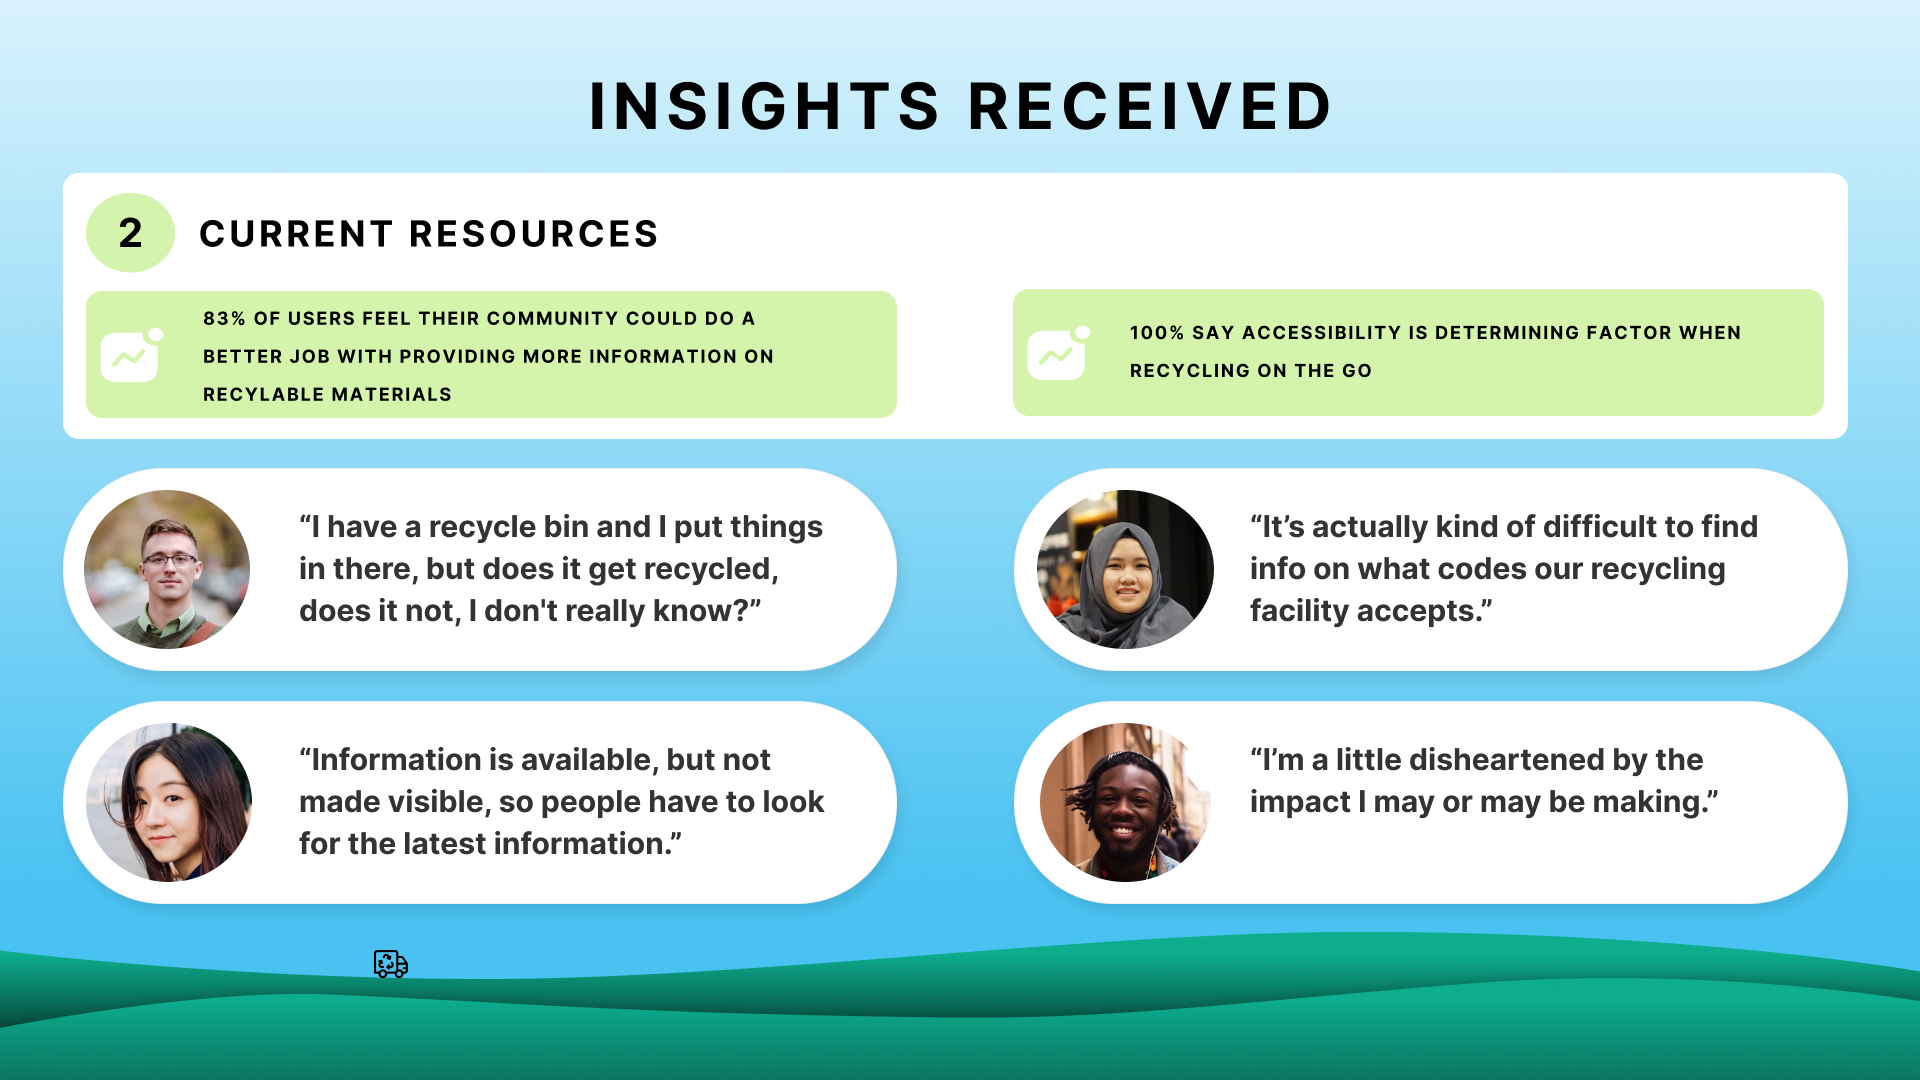
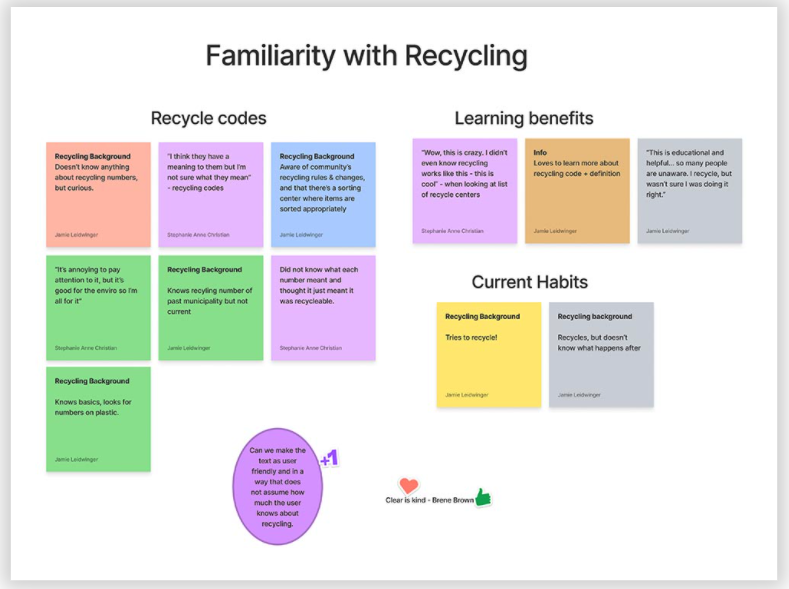
Over 80% of interviewees felt their community could do a better job with providing more information on recyclable materials, and all of them mentioned accessibility is a determining factor when recycling.

I wanted to know what current apps people are already familiar with in the categories of: data input, education, and scanning products.
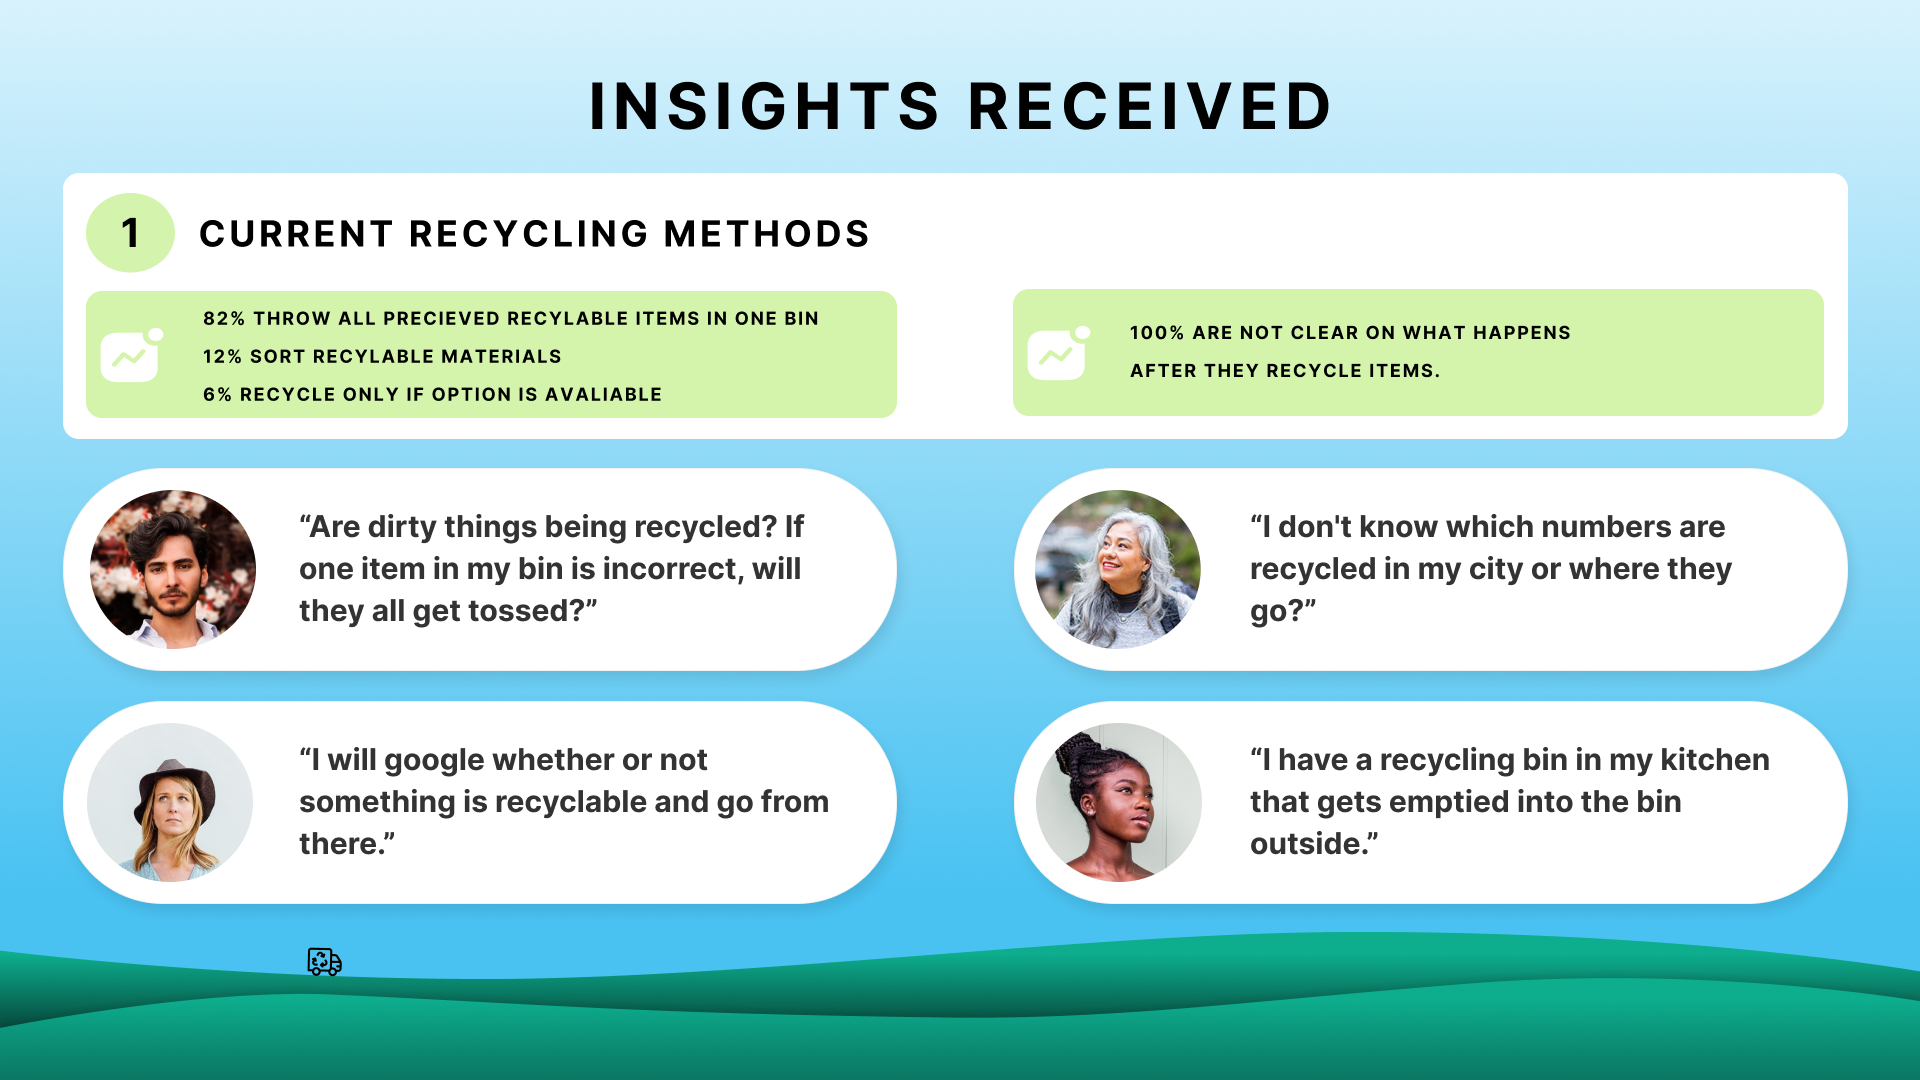
After analysis, some key insights from the user interviews were that 100% of people I interviewed are not clear on what happens after they recycle an item. Users were pretty much confused on the recycle process as a whole, is this item truly recyclable? Is it getting processed and repurposed? I don't really know and that’s the extent of my knowledge.
Design Recommendations
-

Scanning Feature
It came to the agreement that our users needed clear instructions on what to do. For this we thought of a scannable feature where users could scan a product in hand and then get real-time information on best recycling practices.
-

Impact Made
Users also wanted more knowledge on their impact made, so we knew we wanted to provide more education and a roadmap into their communities process.
Define
Making informed decisions
We started questioning how can we provide a platform for people to engage, educate, and create sustainable action? How can we create an impact-driven platform that gives users the real-time data they need. How can we provide users with clear actionable results?
Design Inspiration
Now that we have our main design ideas, theres one more thing to do before ideating our initial wireframes. To continue on the research, a feature analysis was conducted based on current apps people mentioned in the interview process. I think it’s important to familiarize ourselves with what’s already familiar to our users. What can we use that is already working but make it specific to our target audience? An extensive competitive and comparative analysis was completed as well, that broke down each competitor in the categories listed below. This gives us a solid foundation to start moving forward and ideating intentional and actionable designs.
General Overview
Top Level Observations
UI Analysis
Primary Features
UX Takeaways
Onboarding Operation
Ideate
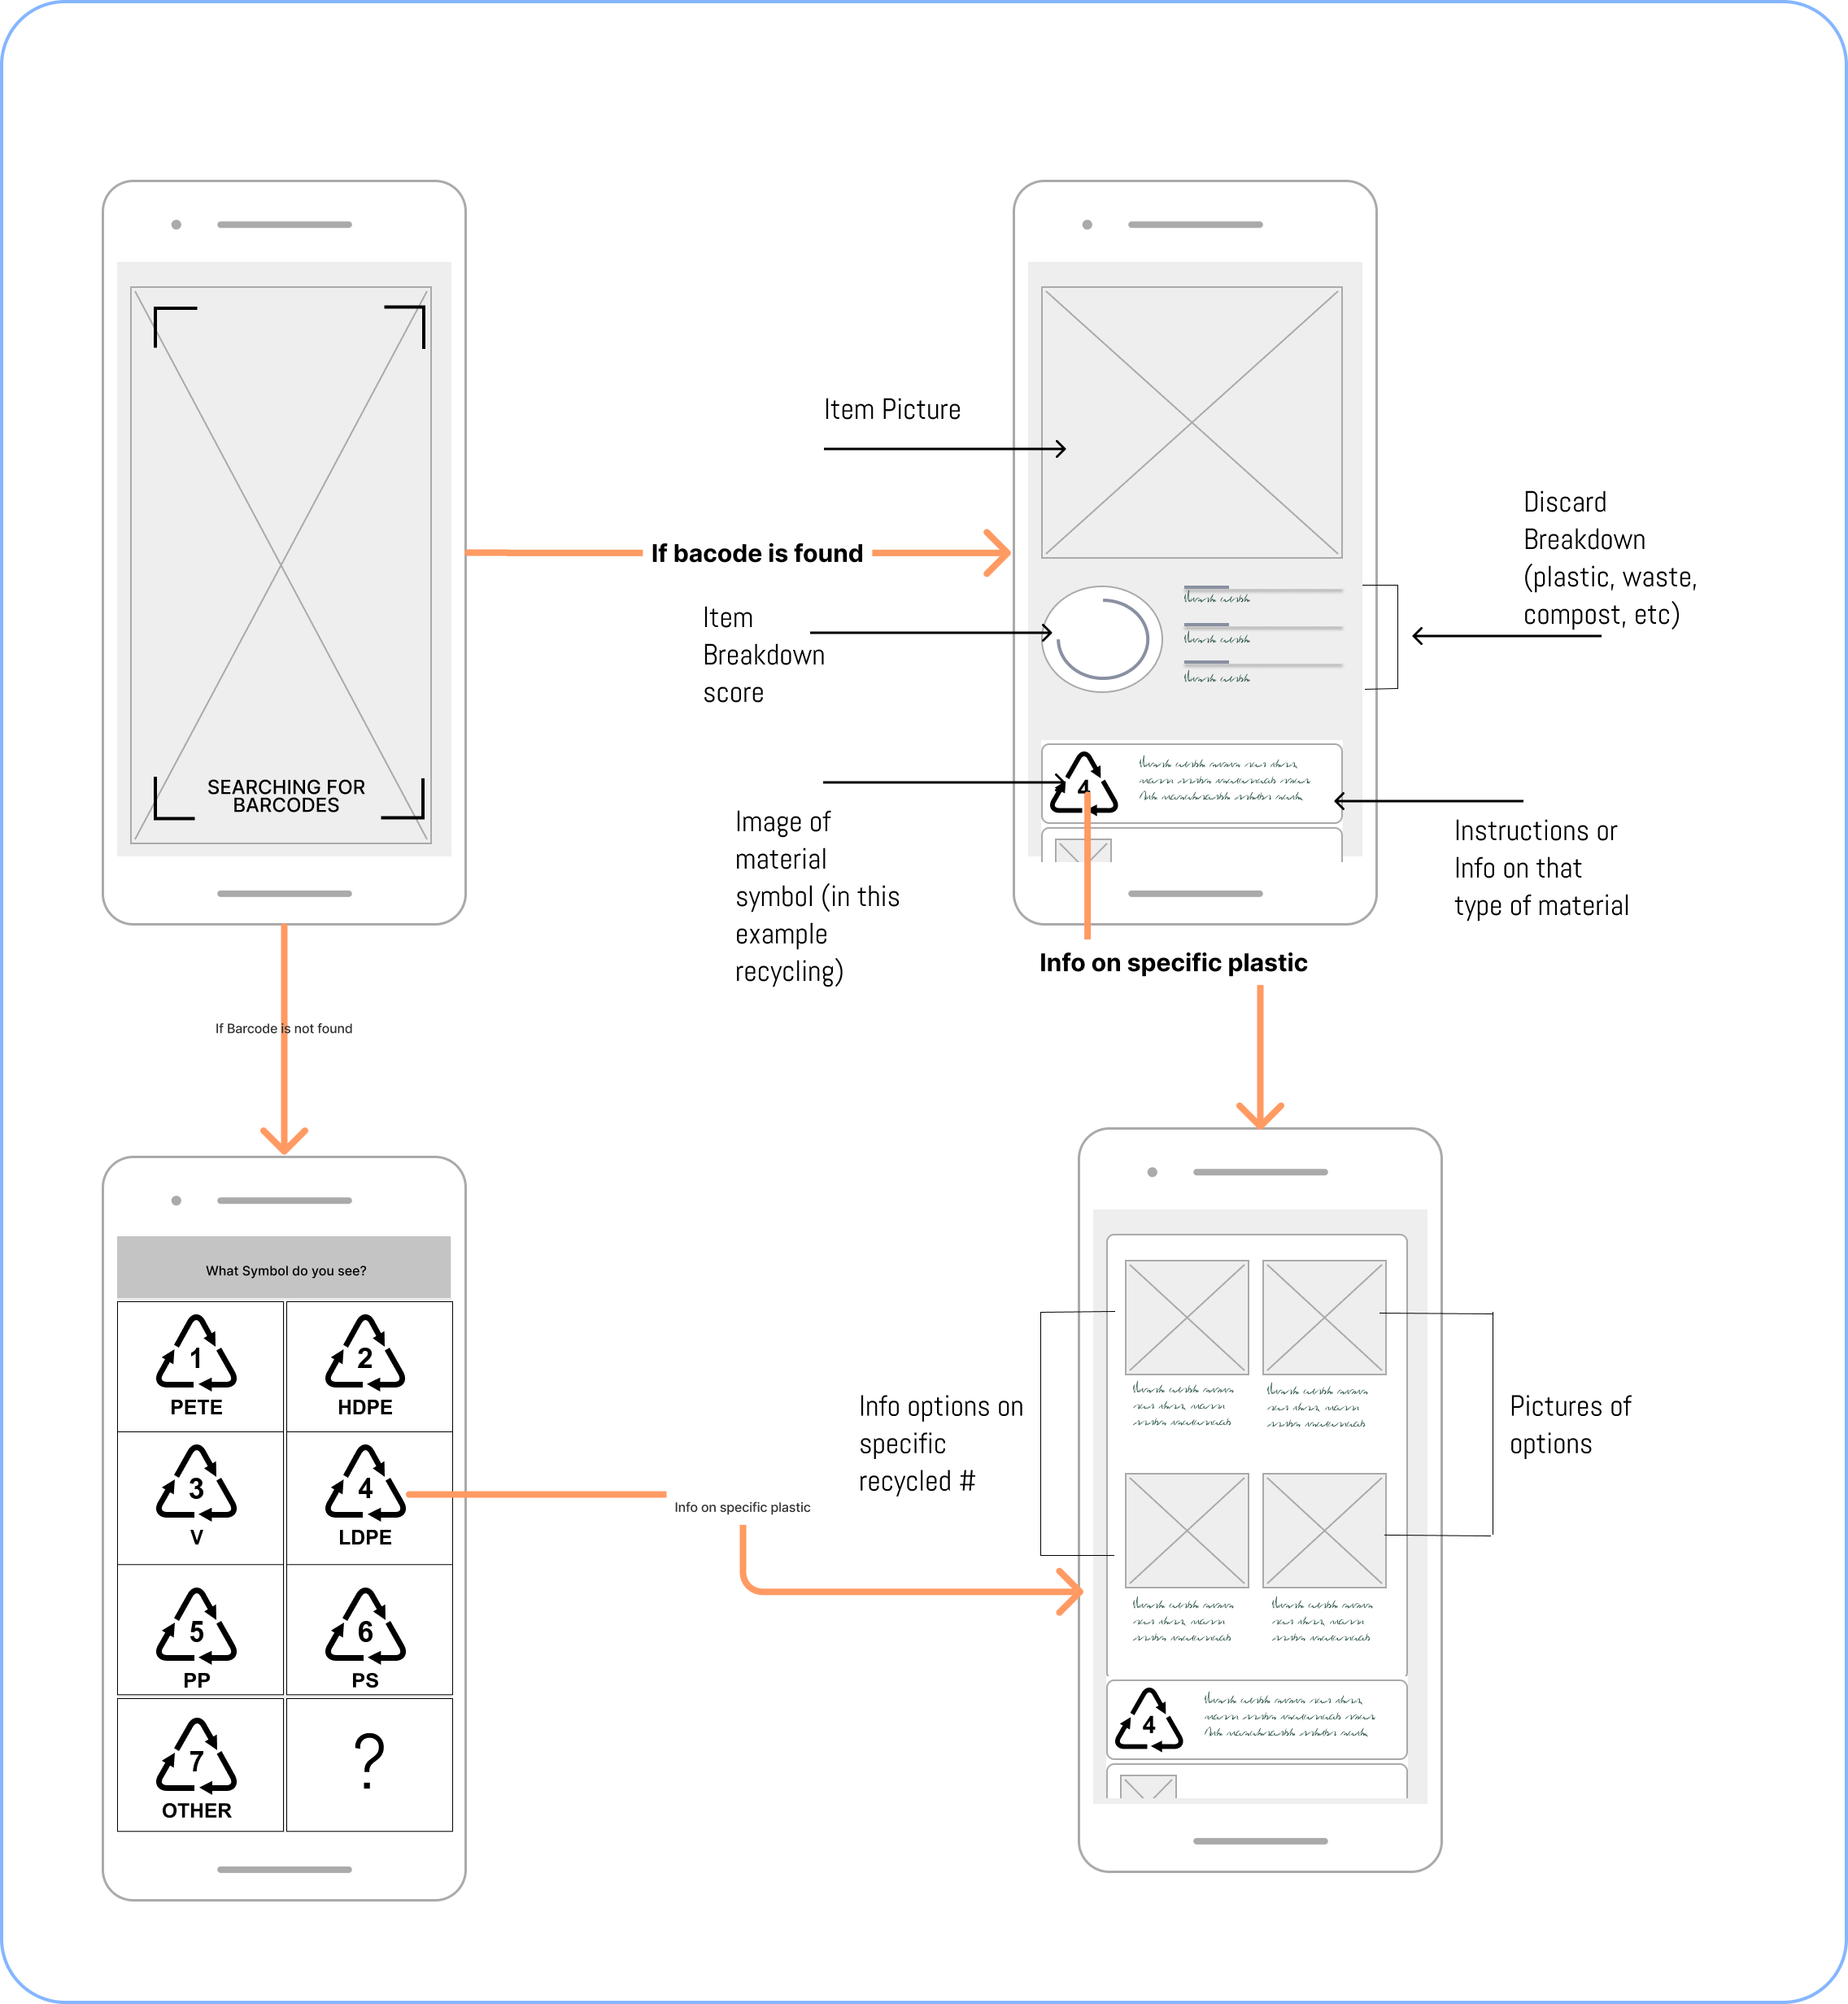
My Initial Wireflow
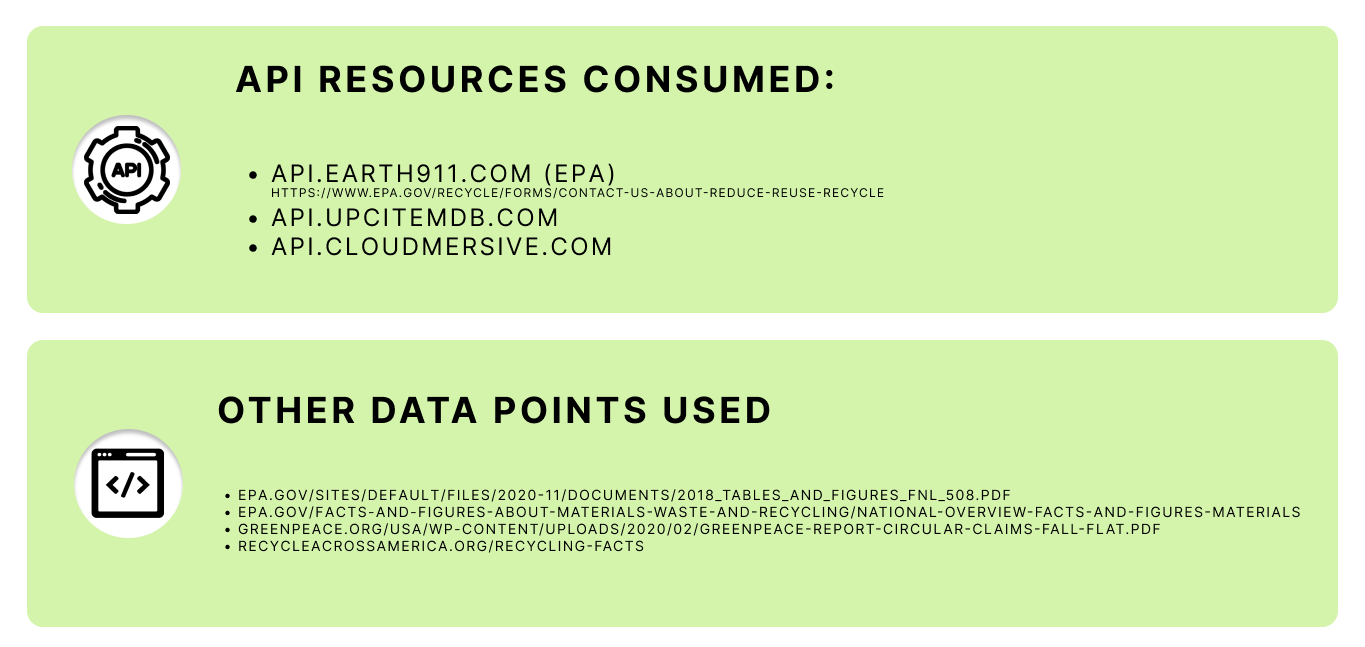
After research, our main features are having a product that scans real-time information and a product that provides education on local impact made. For the scannable capabilities we needed real-time data on product information, such data will come from the barcode.
A way to create impact made is to educate users on best local recycling practices. This will come from the recycling codes/numbers which also provides alternative product information if barcode is not available. We also implemented a correlated map feature that provides information on local recycling centers and the type of material they collect/reprocess.
Challenges & Constraints
Communicating with our Data Scientist we learned that gathering the kind of data that breaks down each product by its material is hard to come by. Rather, let’s iterate to make it break down by barcode API information and focus on whether it’s recyclable or not.
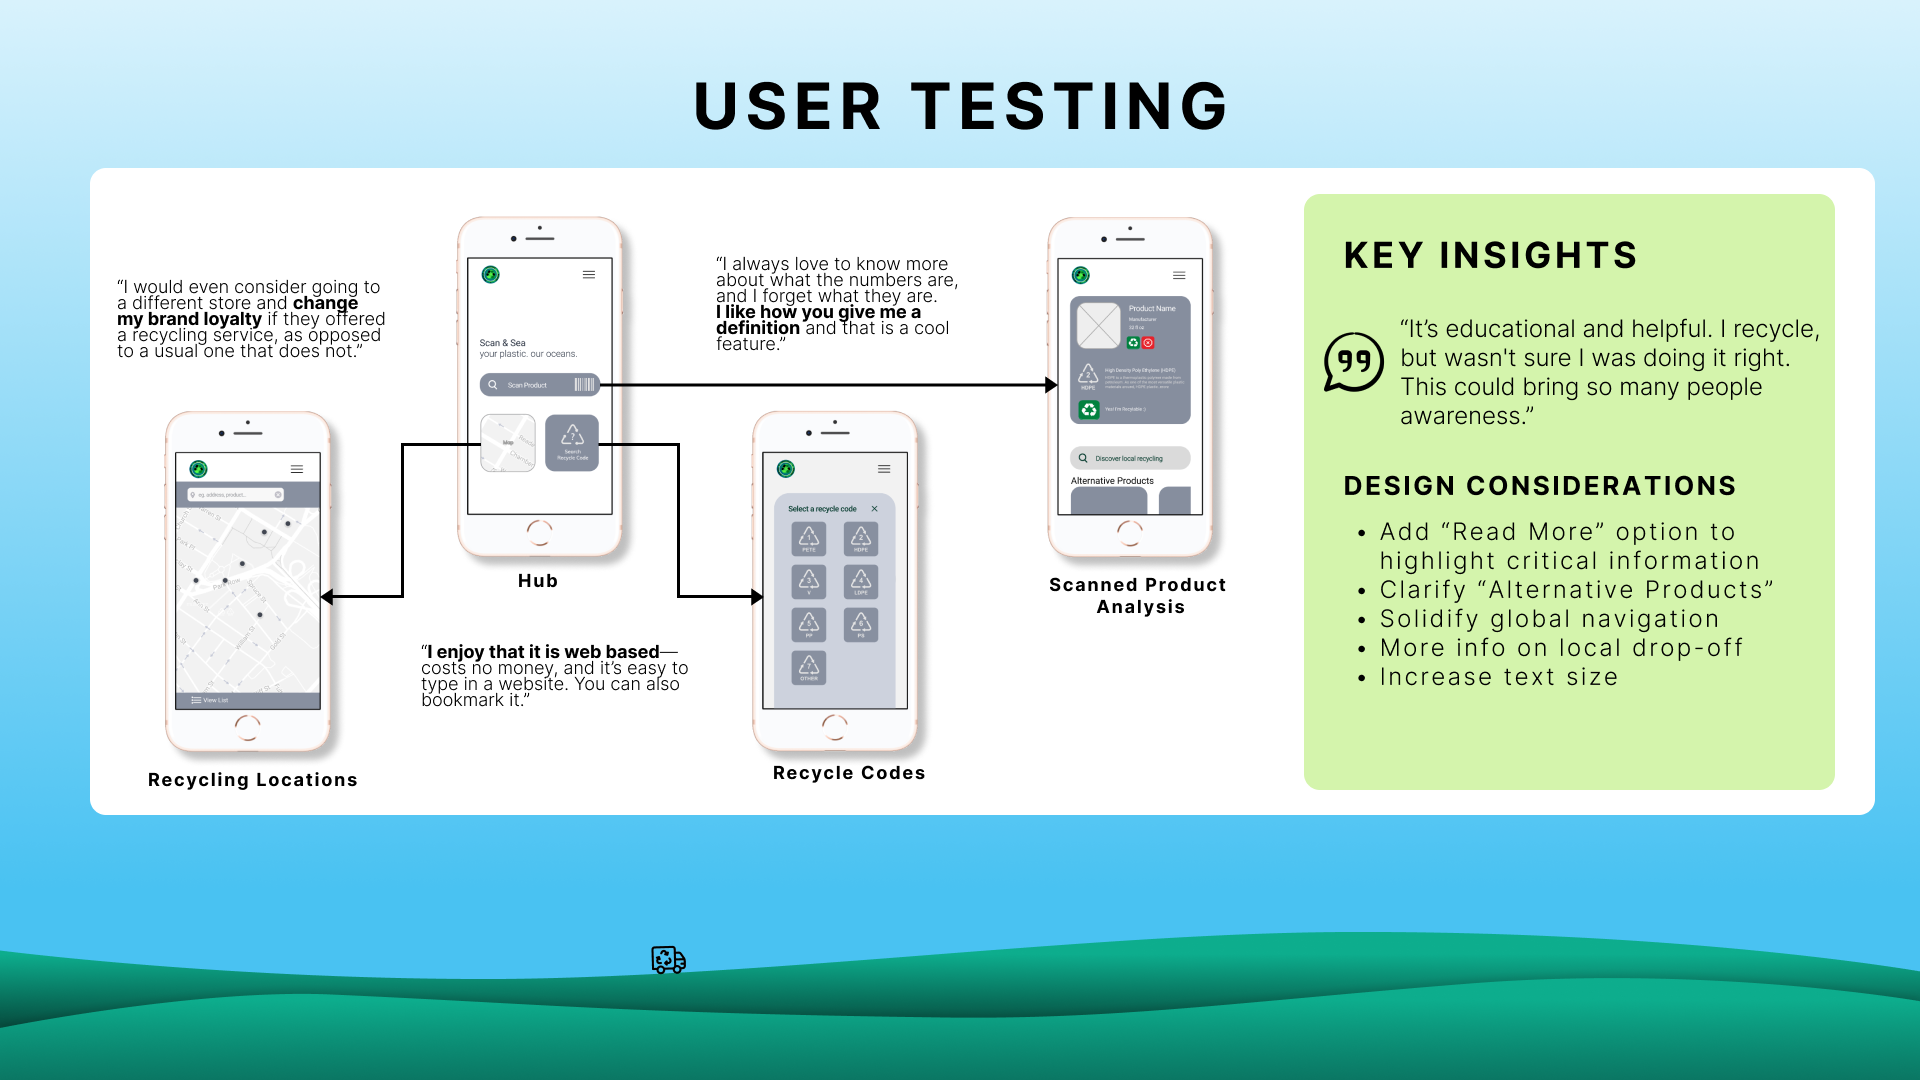
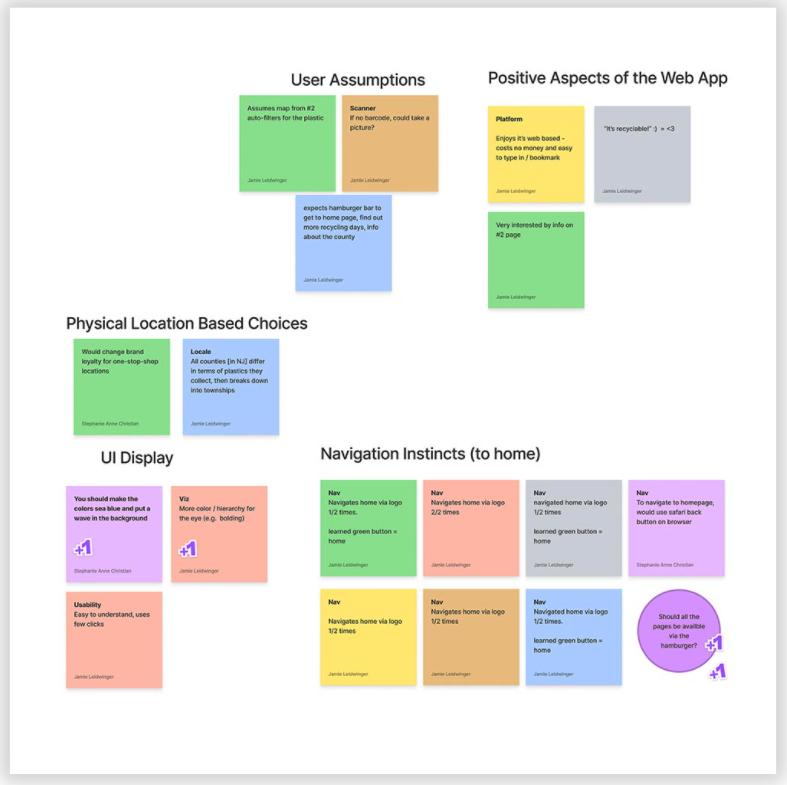
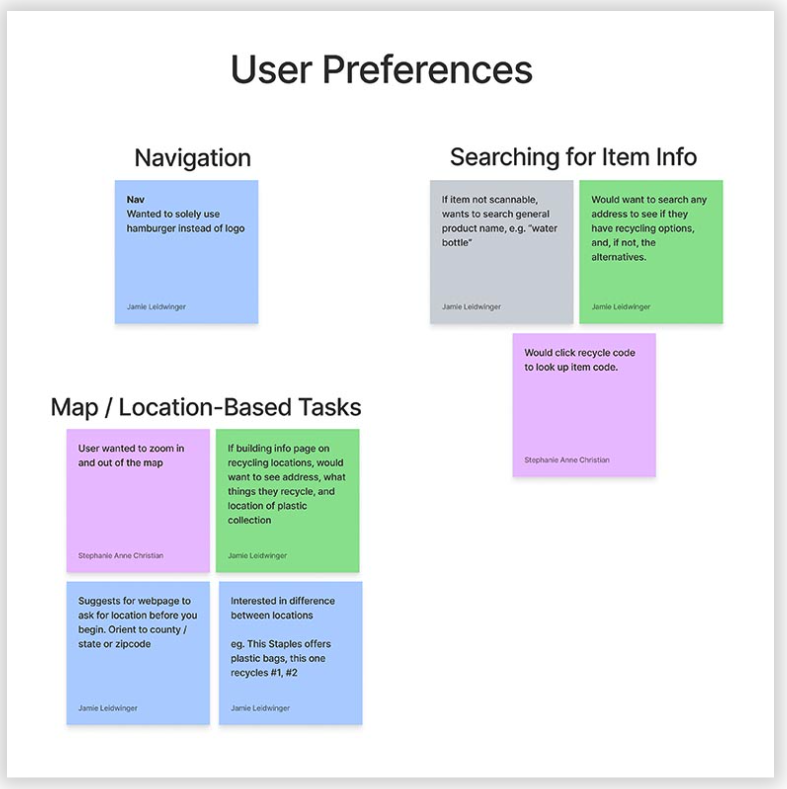
User Testing Info
Task Analysis:
Participants were asked to complete a series of basic tasks with a focus on navigability and feature discovery, in addition to their overall views on knowledge and impact made.
Scenario Example:
“Let's say you have an item in your hand and you're unsure if it's recyclable or not. Can you show me how you would use this app to find out?”
Participants:
7 Participants
Various levels of recycling knowledge
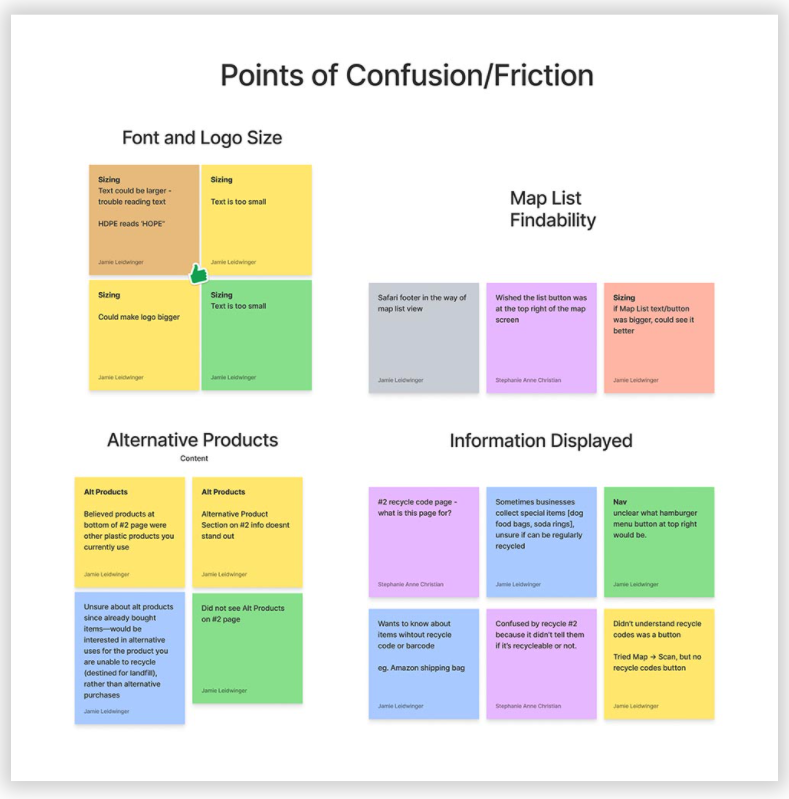
Results:
Actionable information needs to be more clear
Terminology / sizing of text
Map Function - organized info on locations (list and map view)
Navigation - add pages to hamburger menu
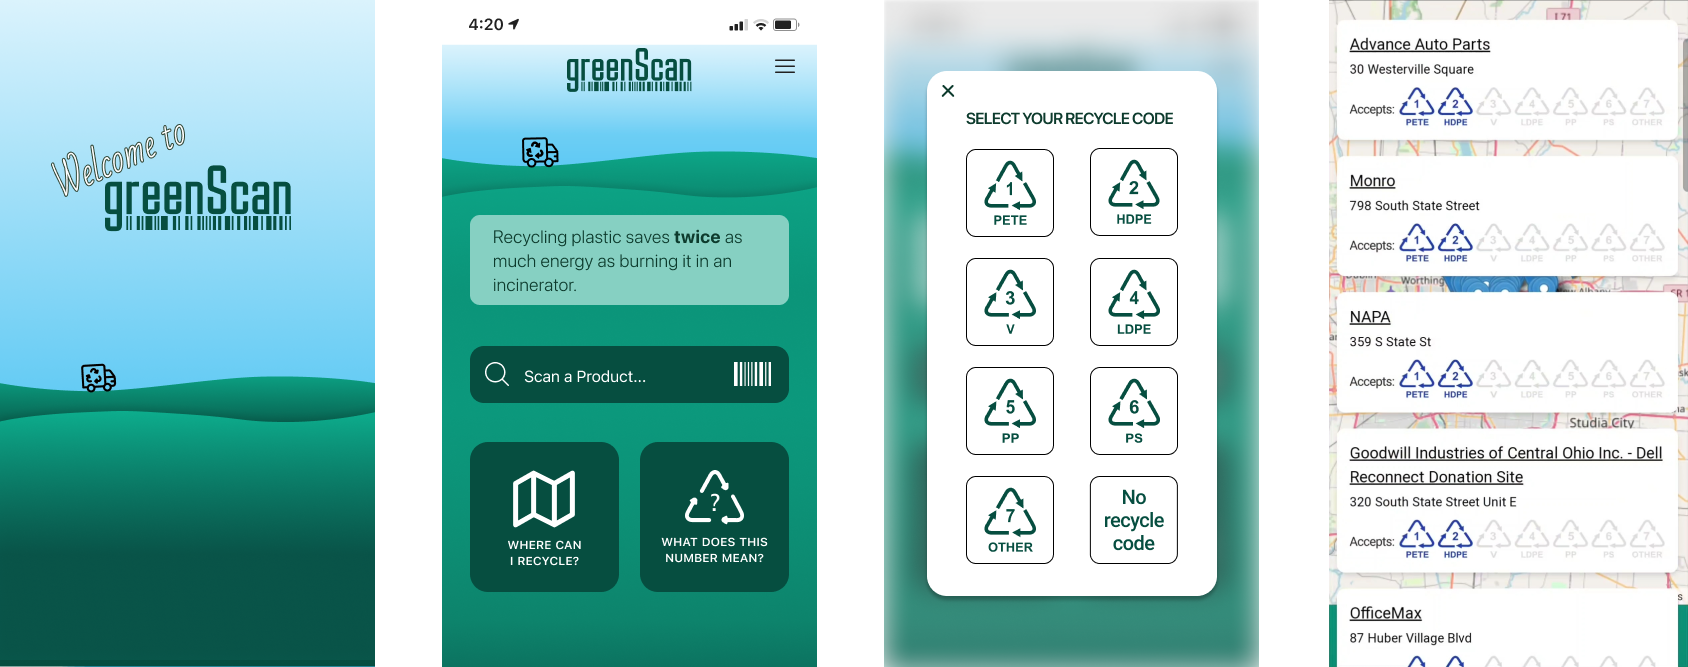
Deliver
After ideation, testing and multiple iterations, our web based application was brought to life with the following specs:

Welcome to GreenScan
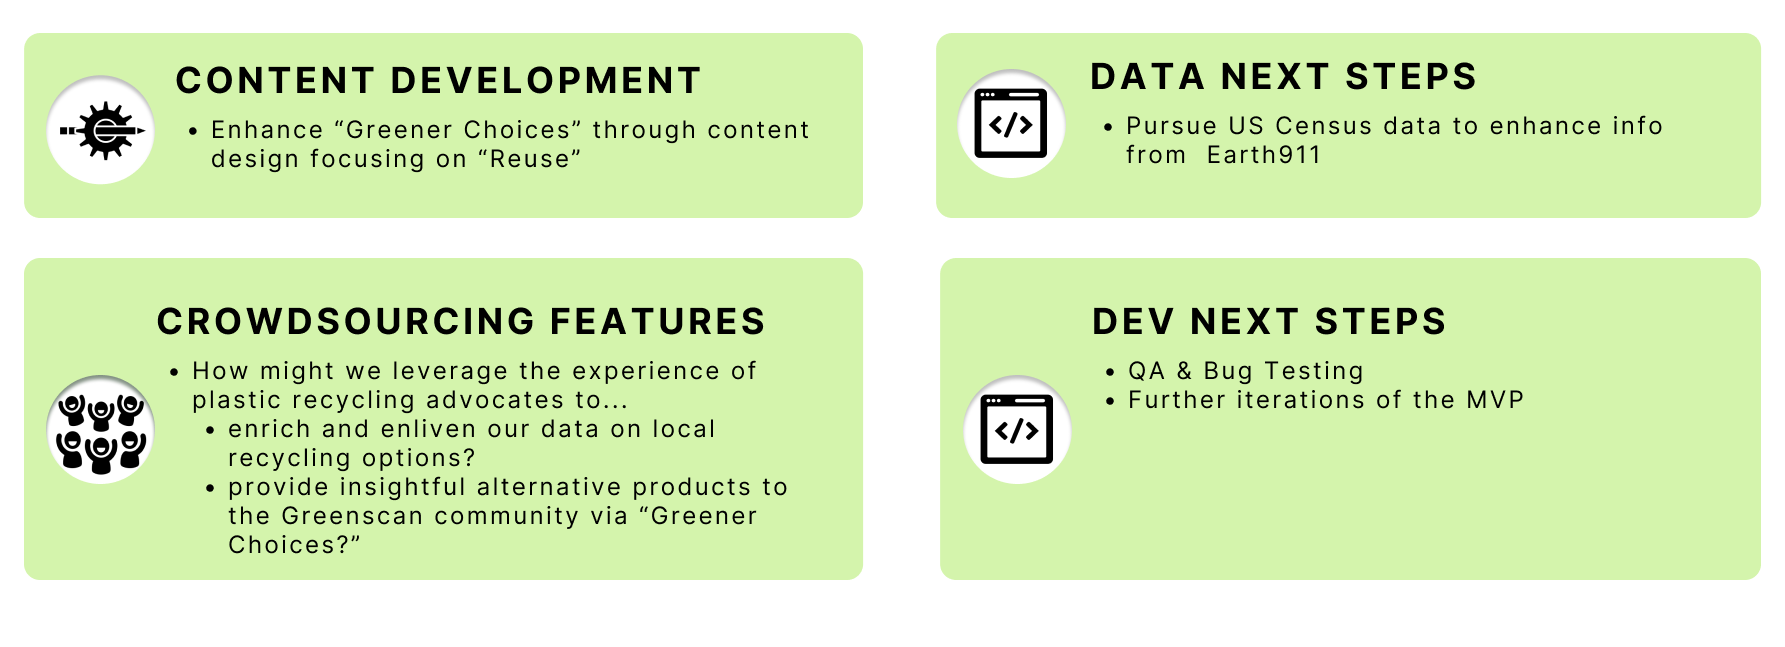
Next Steps
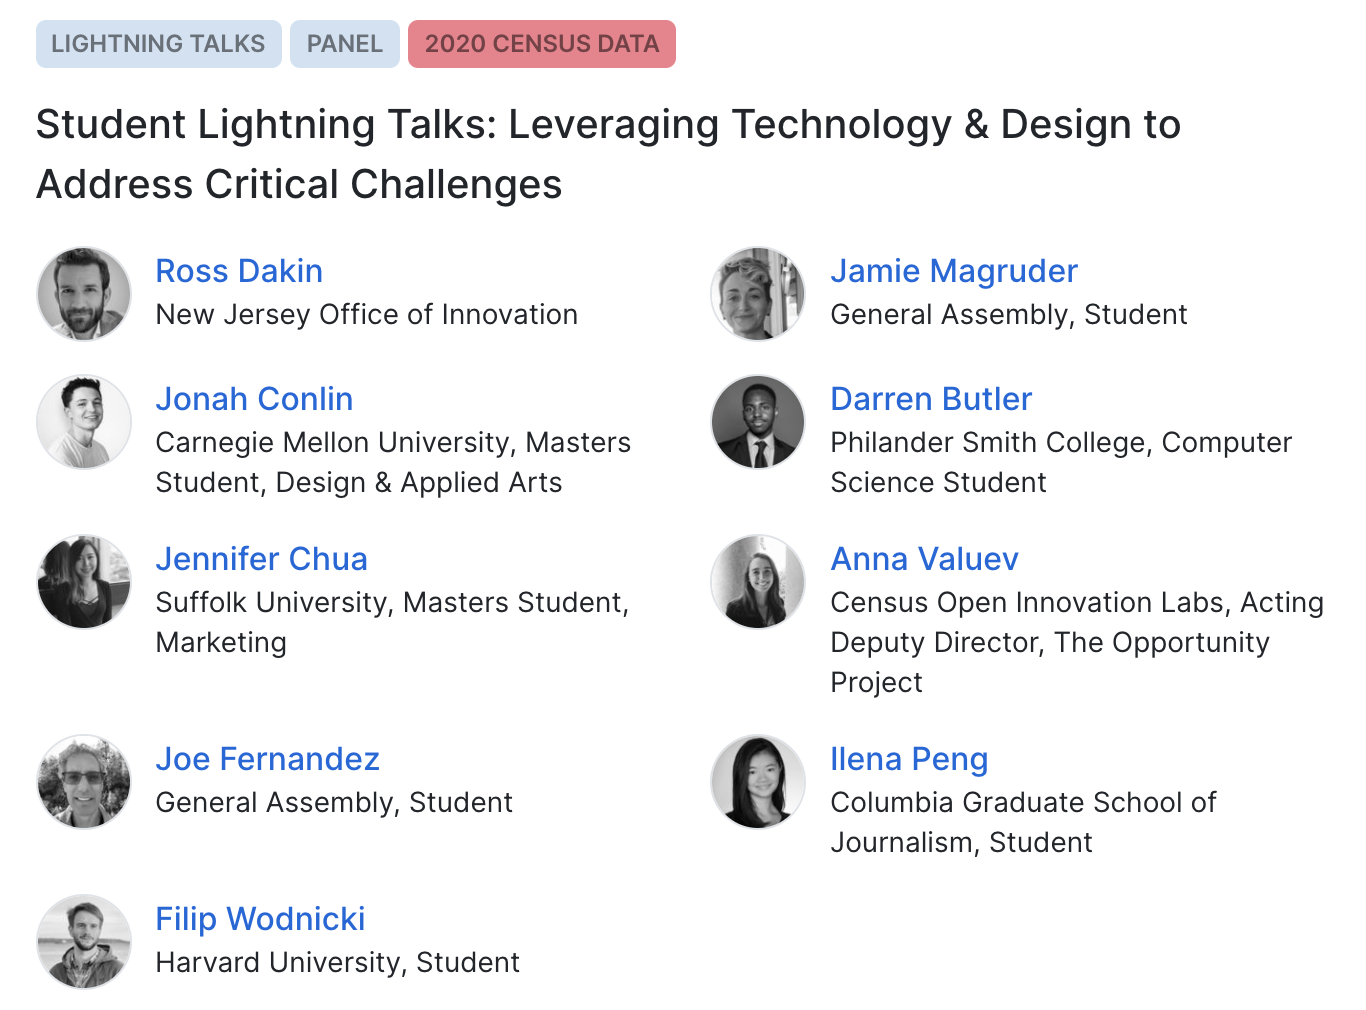
The Opportunity Project Summit
After participating in the U.S. Census Bureau Open Data for Good Challenge, I was invited and chosen by my peers to speak at The 2021 Opportunity Project Summit where I presented along side other chosen students from Harvard, Carnegie Mellon, Columbia, and more.